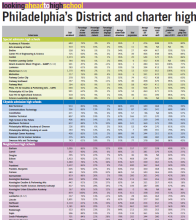
Students examine current data on Philadelphia high schools and use scatter plots to explore how factors such as percent of low-income students, SAT scores, college-going seniors, etc. are related to each other and vary between neighborhood, citywide admissions, special admissions, and charter schools. This lesson is a follow up to Are Attendance Rates Related to Graduation Rates?, where students explore these data using attendance and graduation rates. Students discuss causation versus correlation and other factors that are likely to impact the students who attend each type of school, the resources available to them, and their outcomes.
Students examine current data on Philadelphia High schools and consider correlations between variables such as average daily attendance and 4-year graduation rates. They construct a scatter plot, draw a line of best fit, discuss correlation direction and strength, and discuss whether correlation is likely to imply causation and other factors that might impact both variables. Students notice differences between special admissions, citywide, neighborhood, and charter schools and reflect on them as a social justice issue for all students in the city, as well as considering their personal choices for school admissions.
Adding, Multiplying, or Locating Decimals and Unit Fractions on a Number Line
Context
Public Transportation
Maps
Neighborhood
Everyday Life
Display Image
Overview / Lesson Summary
Students use unit fraction or decimal addition, multiplication, or number line placement to explore the question “is it faster to walk or ride public transit?” for trips on a local transit route. This lesson can be modified to any neighborhood with public transit, and has suggestions for adaptations for grades 3, 4, or 5. See Trolley Trips for a 5th grade version of this lesson that focuses only on decimals.
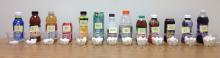
Following students' investigation of sugar content of popular beverages in What's in That Bottle? students use unit rates to compare sugar content across different container sizes. Students then use the data they have gathered from both lessons to debate policies such as the sugar tax, advertising to children, and warning labels.
Representing data on a line plot and finding mean, median, and mode
Context
Neighborhood
School
Social Justice
Display Image
Overview / Lesson Summary
Students examine attendance data on Philadelphia high schools, represent it on a line plot, and use the mean, median, and mode to explore how attendance and other categories of data vary between neighborhood, citywide admissions, special admissions, and charter schools. Students use a visual model which presents the mean as a center of balance (like a fulcrum on a see-saw) to understand the important differences between mean and median and when to use them.
Students build on the strategies they developed in Playing the Lottery 1: What are the Chances? which introduces easier lottery games using simple probability and compound probability with replacement.
In this lesson, students calculate the probability of winning the lottery in a game and explore factorials. They use probability, estimations, and percents to understand the cost of playing the lottery and who really makes money.
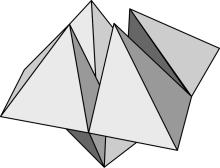
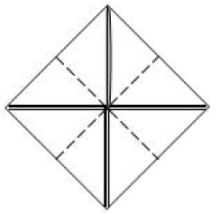
Students explore the mathematical properties of paper fortune tellers. Grade 3 students use tiling strategies for finding the area of rectangular and non-rectangular shapes and express partitioned area in terms of unit fractions. In grade 4, students focus on using multiplication to find areas of rectangular and non-rectangular shapesand identify right triangles.
Finding areas and relationships between areas of triangles, rectangles and trapezoids
Context
Art & Architecture
Everyday Life
Sports & Games
Display Image
Display Image Caption
Fortune Teller
Overview / Lesson Summary
Frequently in mathematics, students memorize and use formulas without understanding where they come from or why they work. In this lesson, students use paper fortune tellers to see how the areas of common polygons (triangles, trapezoids) can be found by decomposing and rearranging the shapes to make rectangles. They also explore the relationships between areas of the shapes that are made in the process of making their own fortune teller. Another version of this lesson, Fortune Tellers: Shapes and Area, in which students identify shapes and find areas by counting squares, is available for grades 3-4.
Students investigate their chances of winning the lottery using simple and compound probabilities (with replacement) represented by tables, tree diagrams, organized lists. From these, they develop algorithms for calculating compound probability using multiplication or exponents.
This lesson can be followed by What is the Cost?, where students compare prize amounts with the chances of winning those prizes and use compound probabilities (without replacement).
In this lesson, students will investigate the Stop and Frisk policy which was implemented in Philadelphia in 2008. Students will use a simulation to model the rates at which pedestrians of varied races would be stopped if the stops were made at random, and then compare this to the actual data to explore the consequences of the policy in terms of social justice. Mathematical concepts include theoretical and experimental probability, sampling, the law of large numbers, and simulations. Students also learn that by using mathematics to analyze publicly available data they can demonstrate racial bias.

 Exploring High School Data 2: What's Related?