
 What's Related? Student Handout
Exploring High School Data 2: What's Related?
Submitted By:
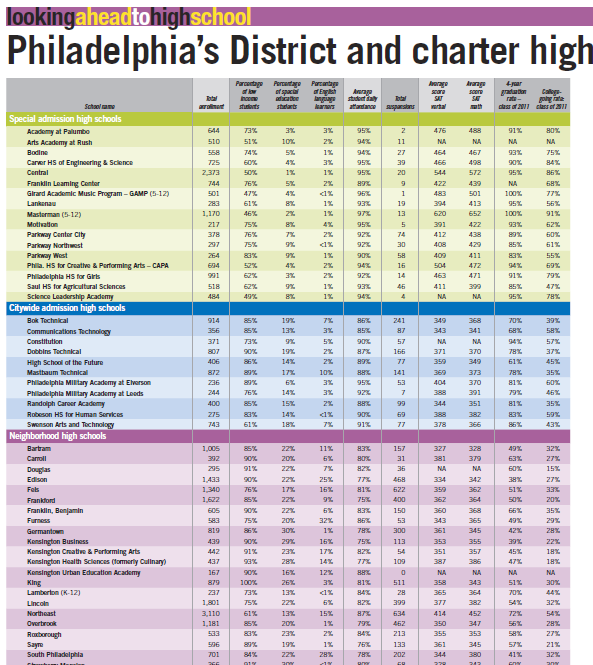
Students examine current data on Philadelphia high schools and use scatter plots to explore how factors such as percent of low-income students, SAT scores, college-going seniors, etc. are related to each other and vary between neighborhood, citywide admissions, special admissions, and charter schools. This lesson is a follow up to Are Attendance Rates Related to Graduation Rates?, where students explore these data using attendance and graduation rates. Students discuss causation versus correlation and other factors that are likely to impact the students who attend each type of school, the resources available to them, and their outcomes.
- List of questions and ideas about Philadelphia high schools from Lesson 1
- High school data for the current year for your district. (We've linked the 2016 Philadelphia High School Data.)
- Optional: Computer software, such as exel, for creating scatterplots or grid paper for making hand drawn plots
- Prepare a system for students to share their scatterplots with the class (smartboard, document camera or overhead projector)
Review with students what they learned about attendance and graduation rates and what questions they still have about high school selection and the data in 2016 Philadelphia High School Data. Look back at the questions and ideas from the previous class.
- We looked at the relationship between attendance and graduation rates for neighborhood, citywide, special admissions, and charter schools. What did we learn?
- What other questions could we explore?
Invite students to return to the data to generate new questions that they are interested in exploring.
Review procedures for making scatter plots to prepare them for greater independence in this lesson.
- In this lesson, you will make a scatter plot using variables that you choose. What do you want to remind yourself about making scatter plots and finding correlations before you start?
- Remind students that they will need to determine an appropriate scale for their plot.
Explain to students that they will be following the same procedures as in the last lesson, but exploring variables of their choice. Ideally, help students to choose different variables in each group.
Have students be prepared to share their scatterplots, either on a document camera or smartboard, or on a transparency for an overhead projector.
Circulate to support students in both completing the scatter plot and thinking critically and creatively about patterns that they see. Students can refer back to the previous lesson for ideas. The What's Related? Student Handout includes some questions to guide their work.
- Students choose two variables to study, create a scatter plot, describe the correlation, and find the equation for the line of best fit.
- Students think of possible explanations for the trend. Students look at the patterns for different school types and discuss their possible causes.
Students will likely have many data sets that show either a negative correlation (one variable increases while the other decreases) or no correlation (one variable increases while the other stays the same or shows no pattern) for either some school types or the whole data set. Often, some school types will be so similar for one variable (e.g., almost every citywide and neighborhood high school has 100% low-income students) that the data clusters instead of showing a trend, while another school type will show a correlation because its data are more varied (e.g., charter schools have wide range of percent of low income students).
Invite each group to share their data, either verbally or by projecting their scatter plots while other groups ask questions.
After students have shared individually, start to look at the different scatter plots in relationship to each other, looking for larger trends. You may want to pair up groups where one variable is the same and one variable is different. For example, special admissions high schools show no relationship between percent of low income students and graduation rates. However, these schools have a negative correlation between percent of low-income students and college-going rates, suggesting that the special admissions schools are not able to provide enough support so that all of their low-income graduates feel prepared and have the resources they need for college.
Wrap up by asking students again to think about the schools that they would like to attend, review what they need to do to apply, and record questions that they still have.
- Have students find and write equations for the line of best fit on their scatterplots.
- Have students read more about Philadelphia High Schools at:http://thenotebook.org/high-schools.
- To find more about charter schools, see http://webgui.phila.k12.pa.us/offices/c/charter_schools/profiles.
- Have students do additional research on the high school admissions process.
- Invite a high school admissions counselor to speak with the class.
- Get involved in the fair funding movement for Pennsylvania school districts and similar local initiatives.


Comments
(no comments)