
Resources

login  |  registerSearch button

Community Based Mathematics Project of Philadelphia

Lesson Plans submitted by CBMP

Grade
Math Focus
Context
Grade
6th Grade
7th Grade
Math Focus
Comparing Data Sets with Dot Plots and Box Plots
Context
Neighborhood
School
Display Image
Photo of a High School Building
Overview / Lesson Summary

Students examine current data on Philadelphia high schools and use line plots and box plots to explore variation in attendance and other factors and compare neighborhood, citywide admissions, special admissions, and charter schools. This lesson is a follow up to Comparing High Schools 1: Attendance Rates, where students explore these data using measures of center.

Common Core Domain
Statistics & Probability
Grade
Math Focus
Context
Grade
6th Grade
7th Grade
Math Focus
Ratio and Proportion; Data Analysis
Context
Nutrition
Display Image
Bottle of Nesquik chocolate milk next to a glass of sugar cubes.
Overview / Lesson Summary

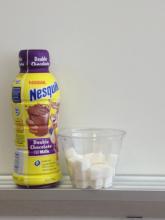
By investigating and representing the sugar content of popular beverages, students use their understanding of ratio, proportion and data analysis skills to read a nutritional label and use data to support an argument. Note this lesson can be followed by Rethink Your Drink 2: A Fair Comparison.

Common Core Domain
Ratios & Proportional Relationships
Statistics & Probability

Pages