
 A Fair Comparison Student Handout
Rethink Your Drink 2: A Fair Comparison
Submitted By:
Following students' investigation of sugar content of popular beverages in What's in That Bottle? students use unit rates to compare sugar content across different container sizes. Students then use the data they have gathered from both lessons to debate policies such as the sugar tax, advertising to children, and warning labels.
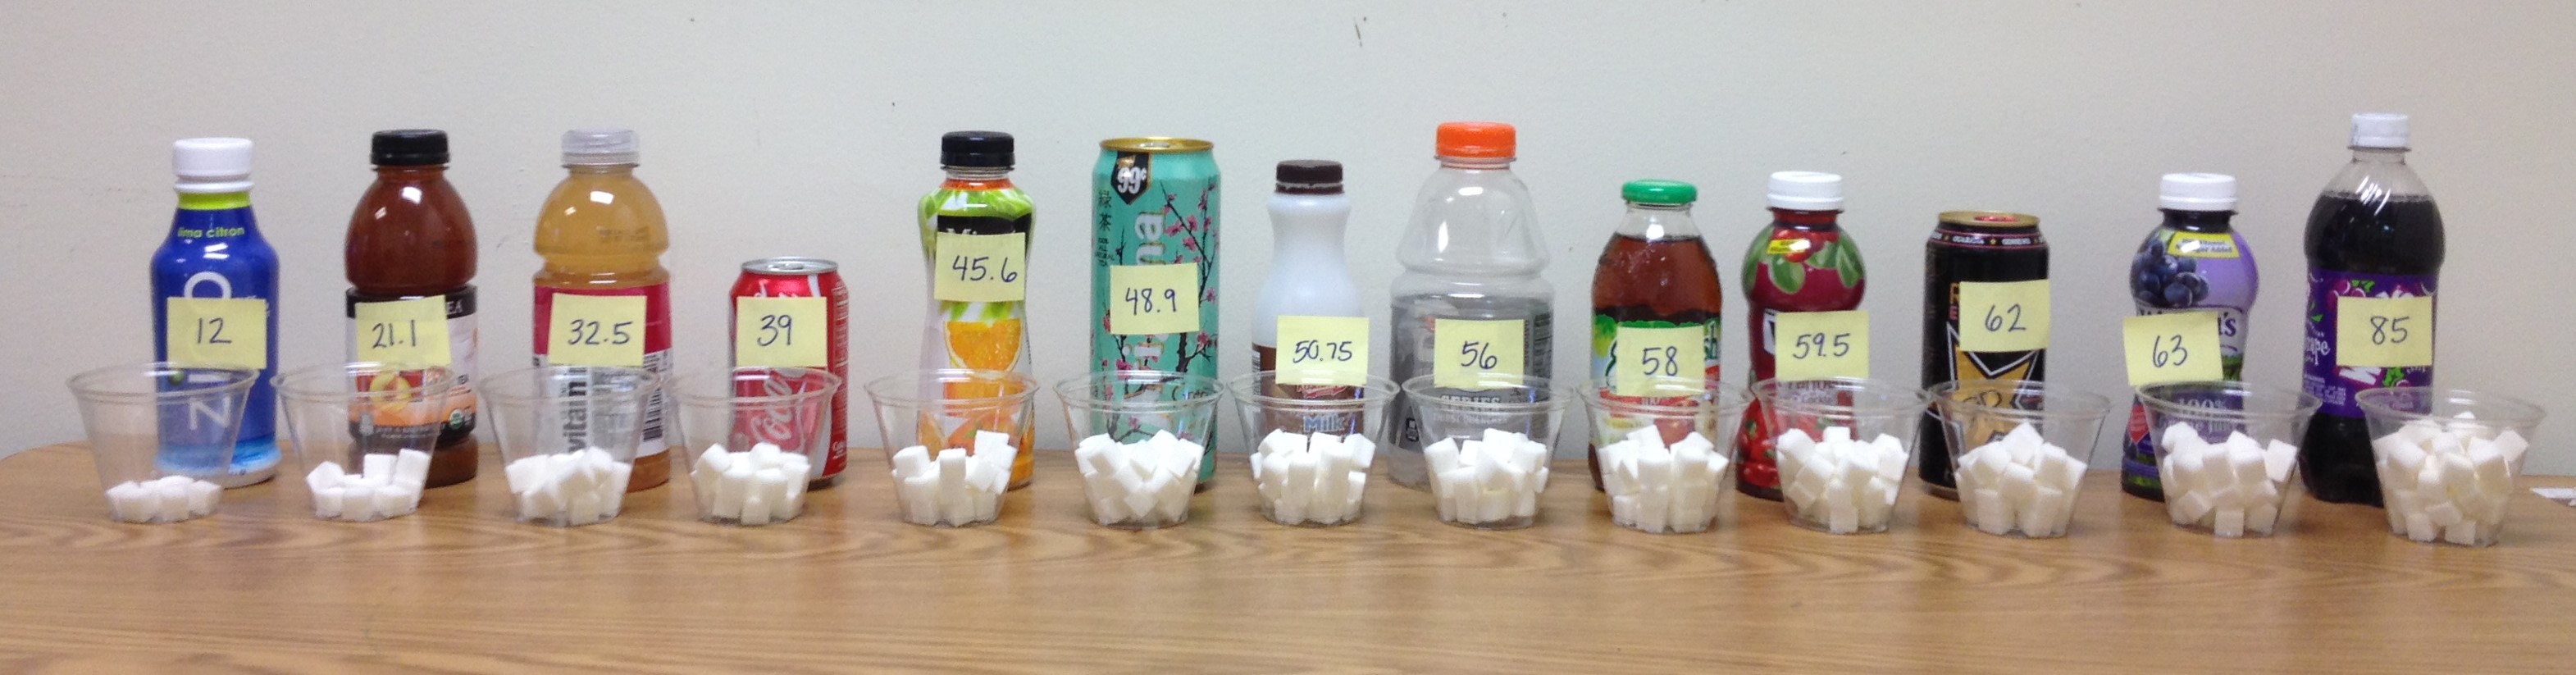
- Display from What's in That Bottle? (lesson 1) showing the bottles, sugar cubes, and labels sorted from least to greatest sugar per bottle.
- Prepare an Excel table from the data, with drink name, ounces of sugar per bottle, grams of sugar per bottle, grams of sugar per ounce. Use this table to create a bar graph in Excel.
Use or recreate the display from What's in That Bottle? (lesson 1) showing the bottles, sugar cubes, and labels sorted from least to greatest sugar per bottle. Display students' questions and ideas from lesson 1.
To begin the lesson, ask students to think about what they learned about sugary beverages in lesson 1 and what questions they still have. Record students ideas and questions.
If it hasn't come up, highlight two containers that are different in size and ask why just comparing the amount of sugar in the containers could be misleading.
Looking at the display of bottles and sugar cubes, ask students to consider why unit rates might be helpful in comparisons.
- In the last lesson, we compared the amount of sugar in each bottle, because people often drink the whole bottle. However, there is a lot of variation in the sizes of bottles, so larger bottles will have more sugar.
- Ask: How could you look at the amount of sugar in drinks so that the comparison is meaningful regardless of the container size or serving size?
- Students may suggest using a standard serving size, such as 8 ounces or finding the amount in 1 ounce
- Support students in recognizing that the unit of measure must be the same, and that the grams of sugar in 1 ounce of liquid is a fair measure for comparison.
Challenge students to determine the amount of sugar in one ounce of Nesquik. Possible strategies include repeated halving (If 8 ounces has 28 grams, then 4 ounces have 14 grams, 2 ounces have 7 grams, and 1 ounce has 3.5 grams) or division (28 grams ÷ 8 ounces = 3.5 grams/ounce, or 49 grams ÷ 14 ounces = 3.5 grams/ounce).
Have students make predictions about which beverages will have the greatest and least sugar per ounce and justify their predictions. Making these predictions helps students to take a personal interest in the outcomes.
On A Fair Comparison-Student Handout, have students record all of the beverages from least to greatest grams of sugar per bottle in a table, and then calculate the grams of sugar per ounce. (Note: if time is limited you may wish to assign each team to calculate only their own bottles and then write them on a class table for everyone to copy.)
Then, students can use the calculations to create a bar graph arraged from least to greatest grams of sugar per ounce. (Note that the table and graph will be in different orders.)
Have students work with their group to answer the questions on the handout about the bar graph:
- What observations can you make from the graph?
- Were your predictions about the drinks with the most and least sugar per ounce correct? What strategies could help you make good predictions about sugar per ounce in the future?
- Look at the order of the beverages in the table and the bar graph. Were there any that moved up or down a lot in the order? (For example, a 32 ounce bottle of Gatorade has 56 grams of sugar, but only 1.8 grams per ounce)
- Why do you think these beverages changed places in the order?
- Were there any that stayed in about the same place? Why do you think this is?
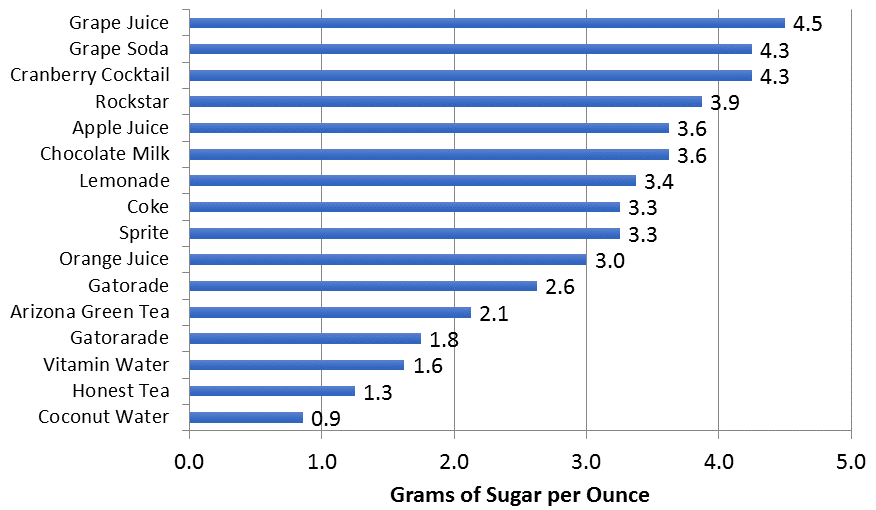
Project the chart you prepared in excel, such as the one below, and have students share the observations they made in their groups.
- Which drinks moved a lot in the order when we compared them by grams per ounce?
- What patterns do you notice in the chart? (For example, fruit juices tend to have about 3 grams per ounce and sodas contain between 3.2 and 3.5 grams. Students may be surprised to see that they are similar in sugar content)
- How can this information help you make healthy choices about what to drink?
Introduce or review that a rate with 1 unit as the second number or reference is called a unit rate. Grams of sugar in 1 ounce of liquid is a unit rate. Ask: How did unit rates help us to compare the amount of sugar in different beverages?
In June 2016, the Mayor in Philadelphia successfully passed a sugar tax of 1.5 cents per ounce to help fund universal pre-kindergarten, community schools, and other development projects. The tax is applied to any beverage that has added sugar.
- Do you think this is a good idea? Why or why not?
- How much will be added to the cost of a 32 ounce soda? A two-liter bottle?
- Some opponents of the tax have stated that it will double the cost of some sodas. Is this true? What size would the soda have to be in order for the price to be doubled by the tax?
- Some argue that it would be better to tax by number of calories rather than per ounce. How would this change the cost of the sodas we looked at today?
Focus on having students use mathematical evidence to support their arguments. Support students in making counter-arguments, for example, that companies have a right to sell anything that makes money, or that people have the right to drink anything they choose.
Note: Berkeley, CA and Mexico are other places that have instituted a sugar tax. See Berkeley's Sugary Drinks Are Getting Pricier, Thanks To New Tax.
Mayor Bloomberg attempted to limit the serving size of sugary drinks in New York City but was unable to do so. See New York's Ban on Big Sodas is Rejected by Final Court.
Have students choose one of the issues on the handout Make an Argument and argue for or against the proposal. The first issue is about whether advertisers should be allowed to market sugary drinks to children. The second issue is about whether sugary drinks should contain warning labels like cigarettes and alcohol.
These lessons can be extended across the curriculum to health, science, language arts and social studies:
- What is the sugar content of the beverage options that are available in the school, cafeteria, or corner store?
- What is the relationship between sugary drinks and the development of type 2 diabetes? How have statistical arguments been used to expose that link? See the Sugary Drinks and Obsesity Fact Sheet from Harvard School of Public Health for a starting point.
- Treating preventable diseases like type 2 diabetes, obesity, and the heart attacks that result cost tax payers billions of dollars each year. Whose job is it to control the amount of sugar that individuals consume? What role do goverments, advertisers, and families play?
- Some schools have policies that do not allow sugary drinks to be sold anywhere in the school. Do you agree with these policies? If your school sells sugary drinks in vending machines or the cafeteria, what could you do to change the policies?
- Instead of sugar, "diet" drinks use artificial sweeteners like aspertame, saccharine, and sucralose. Are these sweeteners healthy?
- Return to students' questions and ideas about what makes drinks healthy or unhealthy from the first day. Investigate other ingredients such as artificial colors and flavors, "natural" flavors, vitamins and minerals, and fat.
- Sugar appears in surprising places. Calculate the grams of sugar per package or per ounce for common foods like candy, bread, salty snacks, yogurt, prepared meals, and so on.
- The reason that sugars do not have a recommended daily amount is that there are several different types of sugars, and it matters how they are consumed (eating them in a whole fruit with dietary fiber is different from drinking them in a fruit juice which is different from drinking them in a beverage with added sugar.) Research how the type of sugar and how it is eaten make a difference for obesity, diabetes, and overall health.
- There are a number of good videos available illustrating the amount of sugar in beverages and how harmful this is. Watch a few of these videos or have students make their own. Have students check to see if the people making the videos correctly understood that most bottles have more than one serving (some of them get it wrong!) If students make their own videos, post them to help educate other viewers.


Comments
(no comments)