
 Penn's Map Powerpoint
Penn's Map
Submitted By:
In this lesson, students look at historic and present day maps of Philadelphia to understand the importance of a grid system in defining locations. Students learn how to navigate and find locations on a coordinate grid.
- You will need the Penn's Map powerpoint for this lesson.
- You may want to read up on the historical background of William Penn's grid plan for Philadelphia. See for example, the article from the Guardian Philadelphia Grid Marks Birth of American's Urban Dream
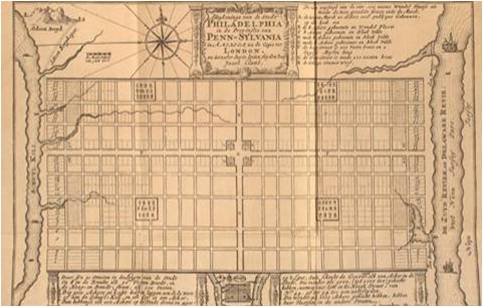
Use the Penn's Map PowerPoint to project the picture of map of Philadelphia from 1683 and give students the handout on Penn's Map. After reading and or discussing the information on the handout about William Penn, ask students for their observation:
- What do you notice about Penn's layout for the city streets? (This is an opportunity to review geometric vocabulary such as symmetry, rectangles, parallel and perpendicular lines, intersection, right angles)
- Is this a good design for a city? Why or why not?
The next slide shows maps of London and Boston around the same time. What is different about the layouts of those cities?
Explain to students that Philadelphia was one of the first North American cities to use a grid system and that William Penn claimed that this design would help prevent overcrowding, fire and disease, which were common in many European cities at the time. Share some or all of the following historical facts to help explain why he decided to use a grid system:
- Penn grew up in 17th century London which had no sensible pattern to its streets, houses that were built too close together, no open green spaces and a physical structure that made its citizens susceptible to spread of disease (Great Plague 1665-66), and its buildings at risk of destruction by fire (Great Fire 1666).
- He wanted Philadelphia to be as fire safe as possible, after he witnessed the Great Fire of London. He laid out wide streets and planned green spaces for parks that would serve as fire breaks.
- He envisioned it as a utopian city: organized in orderly geometric pattern, a rectangular grid divided into quadrants, each quadrant would contain a public park
- He planned it as a collective of country estates: properties to be half-acre or one-acre lots, investors able to plant own garden
Finally, show the current map of Center City, Philadelphia and have students locate what is the same from Penn's Map:
- Note the four "squares": Logan circle, Rittenhouse Square, Franklin Square and Washington Square with City Hall in the middle
- Note the streets are in a grid system
Penn's original design had much larger blocks (one block would have been Walnut to Chestnut, with no Samson in between) but the block were too large for the rowhouses that were built at the time, so they ended up being subdivided.
Note that if you pull up a map of Center City on Google Maps, it will appear to be skewed. This is because google maps uses true north to orient its maps.
The remainder of the powerpoint is animated to show how the streets in Philadelphia are named:
- the vertical, N-S streets begin at the Delaware with 2nd street and increase by one as you move West to the Schuylkill
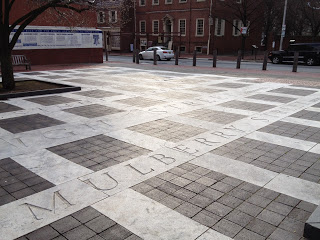
- The horizontal streets are mostly named for trees. You can point out that Race and Arch used to be named for Mulberry and Sassafrass (South St was Cedar St). Tell students that next time they go to the Ritz East movie theatre, look at the layout of the old streets in the plaza out front (see picture below)
- Note that this rendering does not show all the horizontal streets, only the ones that define major blocks with the numbering system.
Explain how the numbering system works to locate addresses through the examples given on the slides
- 1500 Walnut St is at 15th and Walnut
- 876 Locust St would be on Locust, between 8th and 9th
- 200 S 12 St would be on 12ths st, 2 blocks south of Market St. at Walnut
- 150 N. 21st st would be on 21st, 1.5 blocks north of Market St or between Arch and Race
Have students continue to find locations on the map. If you school is in the city, use a map of the local neighborhood around the school to have them find locations and addresses.
- See the article from the Guardian Philadelphia Grid Marks Birth of American's Urban Dream for historical background and the significance of William Penn's grid plan for Philadelphia
- See http://www.phillyvoice.com/infrequently-asked-questions-passyunk-diagonally/ for some interesting facts about the diagnoal streets and turnpikes in Philadelphia (Passyunk, Lancaster, Baltimore)


Comments
(no comments)