
 Sugary Drinks and Obesity Fact Sheet from Harvard School of Public Health
Rethink Your Drink 1: What's in that Bottle?
Submitted By:
By investigating and representing the sugar content of popular beverages, students use their understanding of ratio, proportion and data analysis skills to read a nutritional label and use data to support an argument. Note this lesson can be followed by Rethink Your Drink 2: A Fair Comparison.
- 15 to 20 different containers of popular drinks including sodas, ice teas, sports drinks, energy drinks, vitamin drkins, juices, and flavored milk. Containers may be empty or full, but must have complete nutrition labels.
- Sticky notes or index cards, markers, and tape
- 15 to 20 clear plastic cups
- Around 600 sugar cubes
You may want to read Sugary Drinks and Obesity Fact Sheet from Harvard School of Public Health to give you some background on the link between sugary drinks and obesity to help guide this investigation and help students discuss the implications.
Begin by showing students a variety of popular drinks, including sodas, ice teas, sports drinks, energy drinks, juices, and flavored milk. Use this selection, or project page 1 of the handout What's in That Bottle?, to build students' interest and discuss what they already know about popular beverages and health:
- Ask students which beverages they think are the healthiest and least healthy. There is no one right answer to this question; students may focus on the amount of calories, sugar content, artificial ingredients, caffeine, vitamins, etc. Record students’ questions and ideas.
- After the class has had a chance to discuss their initial ideas, agree that while there are many different factors to consider, this activity will focus on sugar content. Ask students why they think this makes a difference. Use this question to assess what students already know about sugar in drinks.
- Then, have students make a prediction about which drinks have the most and least sugar. Predictions like these are important for getting students to "buy in" to the outcomes of their investigations.
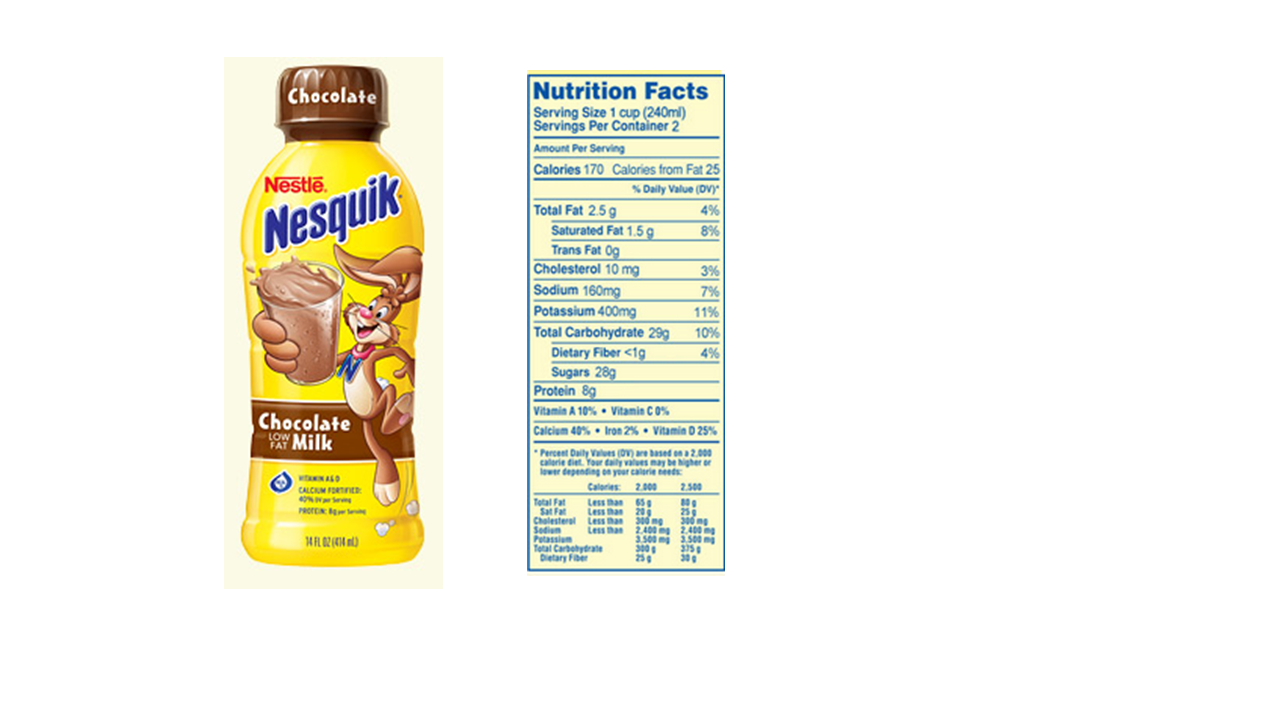
Explore the information that is on nutrition labels, such as the one shown on pg. 2 of What's in That Bottle? for Nesquik.
Before focusing on sugars, discuss what general information is available, for example:
- What information can we find on the nutrition label? (calories, fat, cholesterol, sodium, protein, vitamins, ingredients list, etc.)
- How do they choose what order to write the ingredients in? (The ingredients are listed by the percent of the total product, from most to least.)
- What is a percent daily value? (There are guidelines for the amount of nutrients that someone should eat each day, based on a moderately active adult who needs a total of 2,000 calories per day. The fat, cholesterol, and sodium are the maximum amount per day. The vitamins and dietary fiber are usually the minimum amount per day. The sugar has no percent daily value because different types of sugars work differently in the body, however sugars are part of the total carbohydrates.)
- Next to the nutrition information is a description of the drink. What words does the company use to make you think that Nesquik is a good, healthy choice? (yummy, wholesome, fat-free is mentioned twice, delicious, perfect for when you're on the go.)
- Does this mean that Nesquik is healthy? (Students may have different perspectives. It might be healthier than some other choices because it doesn't have any fat, but it still has artificial flavors.)
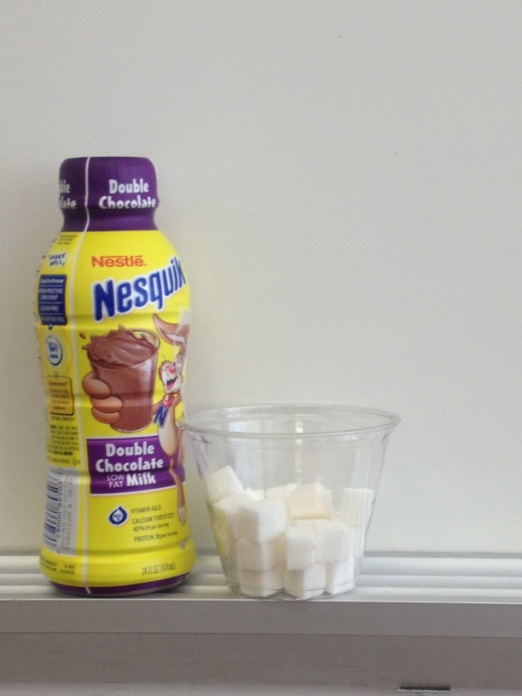
To introduce the mathematical ideas, work with students to find the amount of sugar in one bottle of Nesquik, and then represent it with sugar cubes.
- Have students find the grams of sugar in one serving of Nesquik (28).
- Ask: Is this how much sugar is in the whole bottle? Help students identify that a serving is 1 cup or about 240 mL, but the whole bottle contains 14 ounces or about 414 mL. The nutrition label notes that there are "about 2" servings per container.
- Challenge students to find the number of grams of sugar in the whole container by working independently or in small groups.
- Have students share their approaches. There are several possible methods:
- Because there are “about 2” servings per container, double the amount of sugar: 2 × 28 grams = 56 grams. (Discuss that this estimate is not very accurate in comparison to the others.)
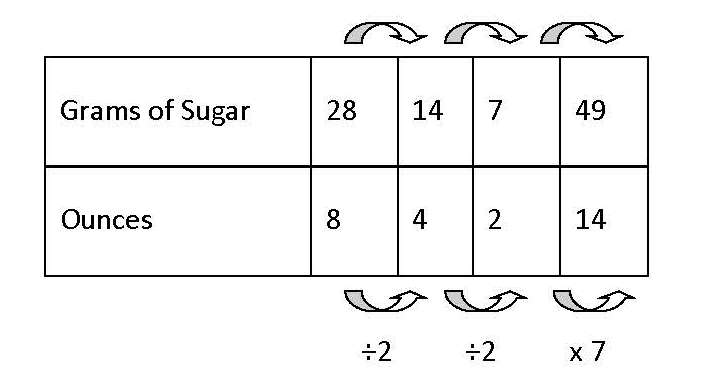
- Find the number of grams of sugar per ounce. There are 8 ounces in a cup, so each ounce has 28 grams/cup ÷ 8 ounces/cup = 3.5 grams/ounce. Then, multiply 14 ounces × 3.5 grams/ounce = 49 grams of sugar.
- Divide the number of ounces in the bottle by the number of ounces in one serving: 14 ounces ÷ 8 ounces/serving= 1.75 servings, then multiply this rate by the grams of sugar listed for one serving: 28 grams/serving × 1.75 servings = 49 grams of sugar.
- Use a double number line or ratio table to scale up from 28 grams of sugar in 8 oz to 49 grams of sugar in 14 oz
- Discuss that some containers report the amount of sugar per serving and per container while many do not. The number of servings per container is often an estimate. Likewise some container sizes are an even multiple of the serving size while some are not.
Next, represent the amount of sugar in the bottle with sugar cubes. This helps students to have a visual model for common measurements and concretely understand just how much sugar is in each bottle.
- Each sugar cube is equivalent to 2 grams of sugar. Have students determine the number of sugar cubes necessary to show the amount of sugar in the bottle.
- Students can use simple division to determine the appropriate number of sugar cubes to use. The chocolate milk, which has 49 grams of sugar, requires 28.5 cubes, so we can round up to 29.
- Count out 29 cubes and put them in a clear plastic cup.
- Using a sticky note or folded notecard to create a label that says "Nesquik 14 ounces, 49 grams of sugar" and place it on the bottle.
- Demonstrate putting the cup, the label, and a bottle of Nesquik on a table that will be used to make a class display.
- Explain to students that when they put their bottles on the table, they should order them from least to greatest sugar per bottle.
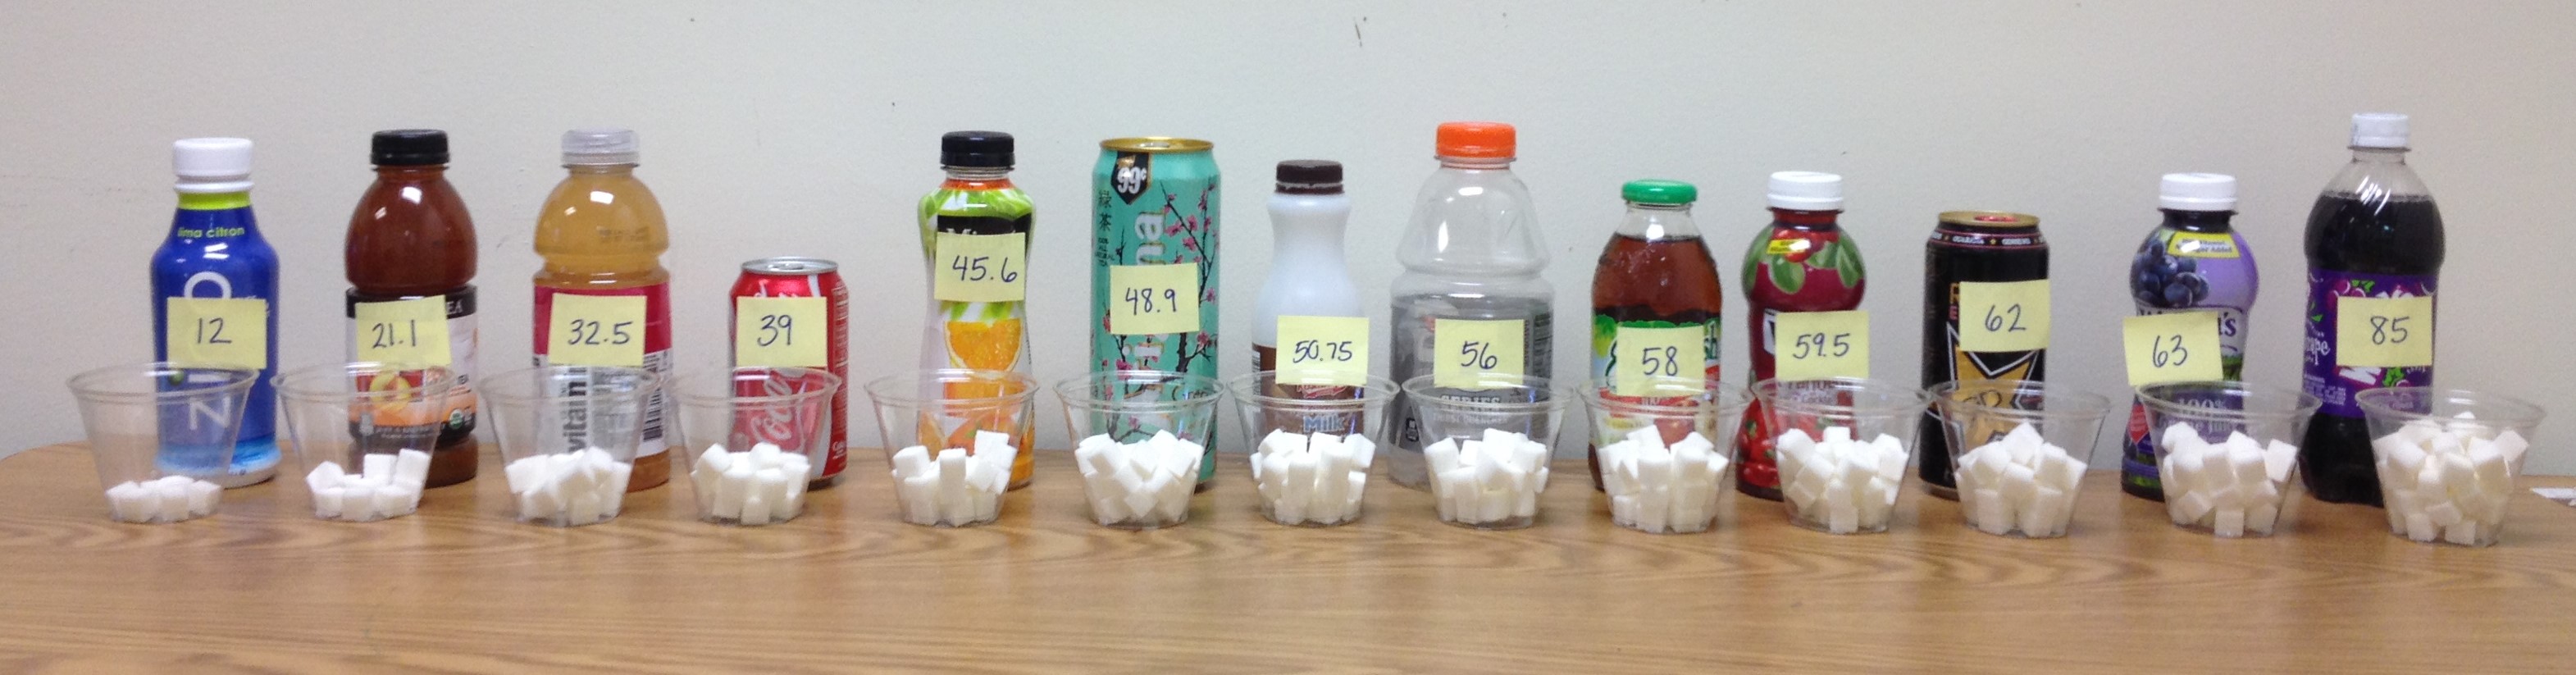
Distribute the containers to small groups of students and have them use page 3 of the What's in That Bottle? Student Handout to follow the same procedures to calculate the grams of sugar in each bottle and represent it in sugar cubes.
Check that as each group finishes, they place their materials in an ordered display from least to most in terms of total sugar content, as shown in the picture below.
When students are finished calculating the amount of sugar in their own bottles, have them move on to the exploration of class data on the next page of the handout:
- Look at the amount of sugar in each of the bottles in the class display. What observations can you make?
- Was your prediction on page 1 about the drink with the most sugar correct? Was your prediction close or far off? Why did you think this drink had so much sugar?
- Was your prediction about the drink with the least sugar correct? Was your prediction close or far off? What made you think that this drink had so little sugar?
- How can the data your class collected today help you make healthy choices about what to drink?
As students see the drink containers on display, they are amazed at how much sugar there is in their favorite drinks.
Use the following questions to guide students to discuss and reflect on their findings:
- What information about sugar in drinks surprised you? What information confirmed what you already knew?
- How did your knowledge of ratios and proportions help you to calculate the amount of sugar in these drinks?
Explain that the American Heart Association recommends that adolescents should not consume more than 5 teaspoons of sugar per day, and that adults consume only 5 to 9 teaspoons of sugar per day. Give students the conversion information that 1 teaspoon of sugar is approximately 4 grams.
- Have students determine which beverages have fewer than 5 or 9 teaspoons of sugar. They will need to first figure out how many grams these teaspoon amounts represent by multiplying by 4 grams/teaspoon to get 5 teaspoons = 20 grams or 9 teaspoons = 36 grams.
- Students should use this reference point to recognize that almost none of the bottles or cans are below this amount. (A few options include Coconut Water, Honest Tea, and Vitamin Water.)
- Ask: If I drink one bottle of Vitamin Water (or a similar drink with about the maximum amount of sugar per day), how many more grams of sugar can I eat the rest of the day? Discuss that the one drink uses up the whole amount, so that even eating a little sugar in bread or fruit would put you over the limit.
- Ask: If I want to drink only 5 teaspoons of sugar per day, how many days would it take me to drink one bottle of grape soda (or whatever bottle has the highest amount of sugar)? Support students in answering the question by dividing the total grams of sugar by 20 grams, which is the amount of sugar in 5 teaspoons.
- Ask: Nesquik fat free chocolate milk advertises that it is “wholesome,” which means healthy, nutritious, or nourishing. Do you agree with this claim? Support students to use evidence to make their arguments. They might point out that although Nesquik is fat free, one bottle contains far more sugar than is healthy to consume in one day.
Several additional handouts are included that you can use to guide or design further explorations around these ideas.
Serving Size and Labels presents some data around how drinks are labeled and how serving sizes have changed. You can use these questions to lead a discussion focusing on using mathematical evidence to support arguments. Also support students who make counter-arguments (for example, that companies have a right to sell whatever they want and people have a right to drink whatever they want, even if it harms them.)
- Should beverage companies list the number of grams of sugar and calories per bottle or per serving? Why?
- Should there be a law that limits how many ounces of sugary beverages can be sold in one bottle?
- If you could pass a law regarding how sugary drinks were bottled (for example, the total ounces per bottle) or labeled, what would you change? Why?
When the results of this lesson are combined with current recommendations and statistics such as those below, the lesson can be extended across the curriculum to health, science, language arts and social studies. Below are some suggestions for extensions:
- What is the sugar content of the beverage options that are available in the school, cafeteria, or corner store?
- What is the relationship between sugary drinks and the development of type 2 diabetes? How have statistical arguments been used to expose that link? See Sugary Drinks and Obesity Fact Sheet from Harvard School of Public Health for a starting point.
- Treating preventable diseases like type 2 diabetes, obesity, and the heart attacks that result costs tax payers billions of dollars each year. Whose job is it to control the amount of sugar that individuals consume? What role do goverments, advertisers, and families play?
- Some schools have policies that do not allow sugary drinks to be sold anywhere in the school. Do you agree with these policies? If your school sells sugary drinks in vending machines or the cafeteria, what could you do to change the policies?
- Instead of sugar, "diet" drinks use artificial sweeteners like aspertame, saccharine, and sucralose. Are these sweeteners healthy?
- Return to students' questions and ideas about what makes drinks healthy or unhealthy from the beginning of the lesson. Investigate other ingredients such as artificial colors and flavors, "natural" flavors, vitamins and minerals, and fat
- Sugar appears in surprising places. Calculate the grams of sugar per package or per ounce for common foods like candy, bread, salty snacks, yogurt, prepared meals, and so on.
- The reason that sugars do not have a recommended daily amount is that there are several different types of sugars, and it matters how they are consumed (eating them in a whole fruit with dietary fiber is different from drinking them in a fruit juice which is different from drinking them in a beverage with added sugar.) Research how the type of sugar and how it is eaten make a difference for obesity, diabetes, and overall health.
- There are a number of good videos available illustrating the amount of sugar in beverages and how harmful this is. Watch a few of these videos or have students make their own. Have students check to see if the people making the videos correctly understood that most bottles have more than one serving (some of them get it wrong!) Have students make their own videos and post them to help educate other viewers.
Follow this lesson with Rethink Your Drink 2: A Fair Comparison to explore unit rates and policy decisions.


Comments
(no comments)